IELTS Academic Writing Task 1 with model answer
You should spend about 20 minutes on this task.
The charts below show the results of a survey of adult education. The first chart shows the reasons why adults decide to study. The pie chart shows how people think the costs of adult education should be shared.
Write a report for a university lecturer, describing the information shown above.
Write at least 150 Words.
Model Answer:
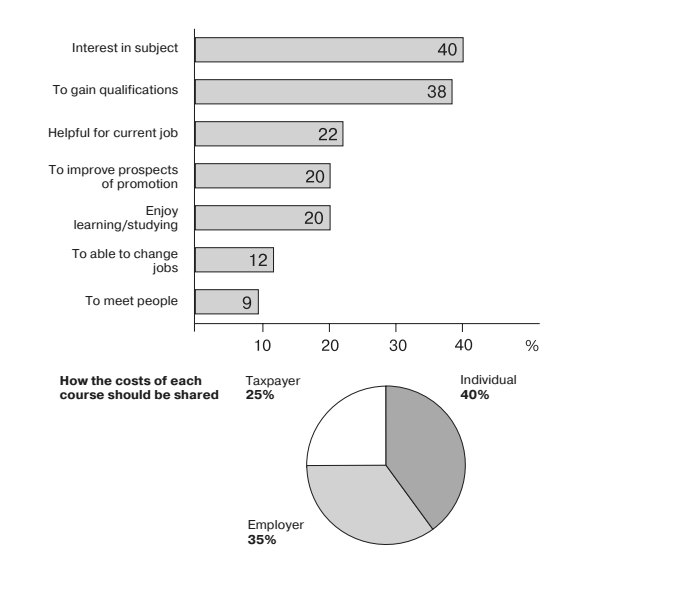
The summary of a survey on adult education is presented in the 2 charts. The bar chart summarizes the factors that caused adults to continue their education, while the pie chart shows the public opinion regarding the cost sharing for adult education.

According to the bar chart, 40% of the respondents mentioned “interest in the subject” as the reason they decided to go back to school. This factor was followed closely by the aim to gain qualification at 38%. On the other hand, only 9% of the survey participants said that they went to school in order to meet more people. This is the least popular reason among the 7 given.
Regarding cost sharing, people are of the opinion that the majority of fees should be covered by the individual (40%), while 35% of them believe that the employers should lend the helping hand. Taxpayers, on the other hand, are only expected to contribute 25% to adult education.
In summary, the survey showed a mixed opinion regarding the reasons and cost sharing for adults education.
Total Words: 192
Task Achievement: 9
Coherence & Cohesion: 9
Lexical resources: 9
Grammar: 9
Overall Score: Band 9
For unlimited feedback with detailed corrections for speaking and writing tasks, sign up for IELTS Twenty20 Online Course today!
Study 20 minutes a day for 20 days and Ace the IELTS exam.
Tags: academic training IELTS model answer writing writing task 1
IELTS Score Calculators and Estimators:
Useful FREE resources for IELTS preparation:
- Free IELTS preparation Course
- Free IELTS Model Answers for Academic and General Writing tasks
- Free IELTS Exam Day Cheat Sheet
Tutorials on Essay Writing
- How to identify the main topic and all parts of the IELTS writing task essay?
- How to brainstorm and organise ideas for writing task 2?
Finally, if you need ongoing feedback from an experienced IELTS teacher for your writing or speaking tasks, simply subscribe to one of our IELTS CORRECTION packs

Comments are closed.
(22 to 12) % reasons are not mentioned in the body part
For Writing Task 1 is better giving an Overview than a Conclusion…
Hi Cami,
As long as you summarise the information from the chart correctly, either of them should be fine… i.e. you can give an overview or a conclusion. Both are not necessary.
Hope this helps.
The figures illustrate the results of a opinion survey what motivates adults to study and how the payment of adult study should be cowered.
Overall, it is clear that most students are lured to study due to their interests in subjects and to obtain the degree. It is also noticed that the large proportion of the education cost should be payed by individuals themselves.
The first chart indicates students individual intention in studying further. According to the survey, adults’ main purposes to continue their education are their interest in exact program and desire to get qualification. As these two reasons result reached 40 and 38 respectively. Meanwhile, the percentages of the survey for reasons “helpful for current job” and “improving prospects and motivation” and that adults like studying were in range between 22 and 20. As for figures of those who study for the purpose of changing jobs and to meet new people, they were below 13 each.
From the second chart, it is seen that the person should be the highest cost bearer for his own study (40). Next comes the employer at 35 and after that the taxpayer with the least burden (25) of the cost.
I need your help. Can you score my writing?!
Dear Dilrabo,
I have sent you a detailed report with my feedback. Hope it helps.
If you need unlimited feedback for writing and speaking tasks, please subscribe to one of the course options using the link below:
https://ieltsonlinepractice.com/membership-options/
Cheers,
Atul.
we can see two different figure in the question • the first one is a bar graph that’s shows the reason why adults decide to study •similarly the next figure is a pie chart that represent how the cost of each course be shared •
it is a next idea of introductory part•
Please rate mine.
The summary of a survey on adult education is represented in two charts. Bar chart illustrates the seven different reasons why adults want to study and the Pie chart represents how adults want their study expenditure to be divided among Taxpayer, Employer and themselves.
Overall, the Bar chart shows us that most adults decide to study because they have interest in a particular subject and to gain information whereas meeting new people and to be able to change jobs are the least popular ones. Moreover, the survey also shows that adults are willing to pay most of their study cost.
Interest in subject and to gain information are the most popular reasons adults want to study they account for 40% and 38% respectively of the total population surveyed. Helpful in current job, To improve prospects of promotion and Enjoy learning and studying account for 22%, 20% and 20% respectively. Furthermore, the survey shows that only 12% of adults wants to study because they want to able to change jobs and 9% of adults want to study because they want to meet new people.
On the other hand, adults thinks their cost of education should be shared with Taxpayer and Employer each sharing 25% and 35% of the total cost respectively and they are willing to pay 40% of the cost themselves.
PS i didn’t copied your first sentence.
qualification ***
Hello,
Please email your task to hello@ieltsonlinepractice.com
I do not have your email to send you the feedback.
Cheers,
Atul.
There is a big mistake in the first sample, which is said to reach 9. The pie chart is about the proportions of the money to pay for the adult education; it is not about what percentages of people think who should pay for it.
Dear Soar,
You are correct.
The report incorrectly interpreted the data in the chart. I have fixed the report now.
Thanks for reporting the error :)
Cheers,
Atul
In describing graphs it’s not necessary to mention every details. You are taught to talked about what is dominant. That is why here the writer only mentioned some highest percentages and the lowest one, meaning the most and the lest popular reason cited by the respondents.
The summary of survey on adult education is presented in 2 charts. The bar chart summarizes the factors that caused adults to continue their education, while pie chart shows the public opinion regarding the cost sharing for adult education.
Overall, the major portion of adults go for higher studies because of their interest in subjects. It can be seen from the pie chart that, individuals shared the highest portion of course cost.
According to the bar chart, 40% of respondents mentioned interest in subject as the reason they decided to go back to school. This factor was followed closely by the aim to gain qualification at 38%. Evidently, 22% of adults support education as it is helpful for their current job, which is twice as much as that of those who study to change their current job. Interestingly, the percentage of adults who aspire study in order to improve their career as well as to enjoy learning is 20% each. Less than one-tenth of them opt for education to meet people.
With regard to the pie chart, 40% of individuals payed course cost by themselves. Furthermore, employers spend more than a third of total expenditure. Taxpayers, on the other hand, contribute a quarter to adult education.
Sir, please comment my post
The given bar chart and pie chart depicts the information about the factor affecting adult education and the cost-sharing of education among taxpayer, individuals, and taxpayer according to the survey conducted on adult education.
Overall, interest in the subject and to qualify became the main reason for further education. The respondents believe that a major portion of cost should be made by individuals who are studying.
It is vivid from the bar chart 40% of adults are pursuing education because they are interested in the subject and a little less than this, 38% of adults are studying to get a degree. 20- 22% of respondents are in school for their job. However, 12 percent of adults are taking education so they can change their job. Only 9% of adults are studying for social engagement.
The people believe that cost should be shared majorly 40% by individuals then-employer can help with 35% of the cost sharing and lastly, the taxpayer can contribute up to 25%.
please score my writing and also where I went wrong
Which tense we need to use in bargraph to describe survey findings?
Dear Anthony,
It is best to stick with past tense to describe survey findings. As such the survey must’ve been done in the past for these results to be available so the data is from the past.
If you are given a time series data i.e. data which is spread over days, months or years, then use the tense as per the time period that you are describing. eg. past tense for the past years and future tense for the future years.
Hope this helps.
Cheers,
Atul.